Plainview
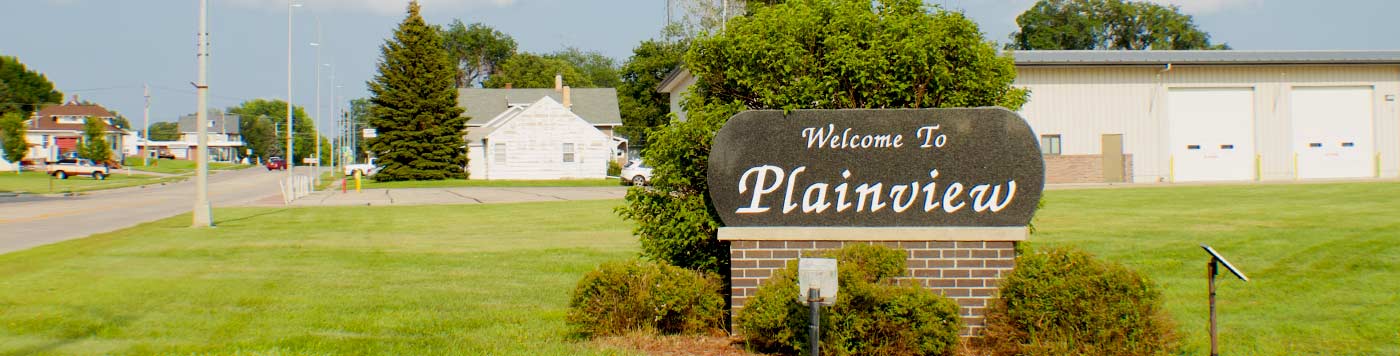
Plainview, Nebraska
Plainview’s downtown is in the process of being revitalized to become a hub of activity. With 26 new businesses opening in the past 5 years, and investments made in parks and recreation, people are coming to Plainview to shop and have fun. Their placemaking efforts and targeted attraction campaigns have been successful in attracting young families and alumni to Plainview, leading to population growth.
Plainview’s strengths include a strong school system, revitalized economy, and fantastic parks and recreation. They recently completed a $139,000 multicourt project, adding new pickleball, basketball, tennis and foursquare courts where you can easily run into friends getting exercise the fun way. The city has invested $250,000 in both parks in the form of new playgrounds, sand volleyball courts, lighting, benches, shades and seating for the pool, restoring the band shell and updating picnic shelters and bathrooms. Visit Plainview’s website for more information.
Population
Population
| Population | 2000 | 2010 | 2023 | 2028 |
|---|---|---|---|---|
| Plainview | 1,396 | 1,289 | 1,257 | 1,223 |
Source: ESRI, 2023-10-17
Population by Age
| Population | 2010 | 2023 | 2028 |
|---|---|---|---|
| 0-4 | 72 | 65 | 57 |
| 5-9 | 75 | 66 | 64 |
| 10-14 | 92 | 68 | 73 |
| 15-19 | 81 | 65 | 64 |
| 20-24 | 43 | 66 | 56 |
| 25-29 | 65 | 76 | 69 |
| 30-34 | 76 | 54 | 75 |
| 35-39 | 63 | 70 | 52 |
| 40-44 | 68 | 81 | 69 |
| 45-49 | 91 | 64 | 84 |
| 50-54 | 91 | 68 | 65 |
| 55-59 | 82 | 84 | 70 |
| 60-64 | 79 | 91 | 83 |
| 65-69 | 64 | 82 | 86 |
| 70-74 | 63 | 82 | 76 |
| 75-79 | 53 | 60 | 66 |
| 80-84 | 53 | 50 | 50 |
| 85+ | 78 | 65 | 64 |
| 18+ | 995 | 1,014 | 983 |
| Median Age | 46 | 46 | 47 |
Source: ESRI, 2023-10-17
Population by Race
| Plainview | 2023 |
|---|---|
| Total | 1,257.00 |
| White Alone | 94.11 |
| Black Alone | 0.72 |
| American Indian Alone | 0.32 |
| Asian Alone | 0.40 |
| Pacific Islander Alone | 0.00 |
| Some Other Race | 1.03 |
| Two or More Races | 3.42 |
| Hispanic Origin | 3.10 |
| Diversity Index | 16.60 |
Source: ESRI, 2023-10-17
Back To TopHousing
Households
| Population | 2000 | 2010 | 2023 | 2028 |
|---|---|---|---|---|
| Households | 598 | 571 | 520 | 508 |
| Housing Units | 665 | 661 | 585 | 585 |
| Owner Occupied Units | 388 | 383 | ||
| Renter Occupied Units | 132 | 125 | ||
| Vacant Units | 65 | 77 |
Source: ESRI, 2023-10-17
Home Value
| Plainview | 2023 | 2028 |
|---|---|---|
| Median Home Value | $122,727 | $127,926 |
| Average Home Value | $195,232 | $210,640 |
| <$50,000 | 80 | 77 |
| $50,000 - $99,999 | 69 | 62 |
| $100,000 - $149,999 | 99 | 94 |
| $150,000 - $199,999 | 33 | 30 |
| $200,000 - $249,999 | 20 | 20 |
| $250,000 - $299,999 | 36 | 42 |
| $300,000 - $399,999 | 2 | 1 |
| $400,000 - $499,999 | 6 | 6 |
| $500,000 - $749,999 | 26 | 31 |
| $1,000,000 + | 4 | 3 |
Source: ESRI, 2023-10-17
Housing Year Built
| Year Range | Houses Built |
|---|---|
| 2010 or Later | 9 |
| 2000-2009 | 23 |
| 1990-1999 | 28 |
| 1980-1989 | 34 |
| 1970-1979 | 41 |
| 1960-1969 | 64 |
| 1950-1959 | 99 |
| 1940-1949 | 74 |
| 1939 or Before | 243 |
Source: ESRI, 2023-10-17
Back To TopIncome
Income
| Plainview | 2023 | 2028 |
|---|---|---|
| Median Household | $50,153 | $55,339 |
| Average Household | $60,649 | $67,888 |
| Per Capita | $25,131 | $28,242 |
Source: ESRI, 2023-10-17
Household Income Base
| Plainview | 2023 |
|---|---|
| <$15,000 | 72 |
| $15,000 - $24,999 | 73 |
| $25,000 - $34,999 | 46 |
| $35,000 - $49,999 | 68 |
| $50,000 - $74,999 | 104 |
| $75,000 - $99,999 | 88 |
| $100,000 - $149,999 | 49 |
| $150,000 - $199,999 | 18 |
| $200,000+ | 2 |
Source: ESRI, 2023-10-17
Back To TopEmployees
Commute
| Category | Commuters |
|---|---|
| Workers 16+ | 576 |
| In-County Residents | 376 |
| Out-of-County Residents | 184 |
| Drive Alone | 431 |
| Carpooled | 67 |
| Public Transport | 0 |
| Work at Home | 25 |
| Less than 5 minutes | 102 |
| 5-9 minutes | 149 |
| 10-14 minutes | 44 |
| 15-19 minutes | 51 |
| 20-24 minutes | 42 |
| 25-29 minutes | 12 |
| 30-34 minutes | 7 |
| 35-39 minutes | 12 |
| 40-44 minutes | 51 |
| 45-59 minutes | 46 |
| 60-89 minutes | 0 |
| 90+ minutes | 34 |
| Average Travel Time | 0 |
Source: ESRI, 2023-10-17
Source: ESRI, 2023-10-17
Employees by NAICS
| Category | Number |
|---|---|
| Total Employees | 693 |
| Agr/Forestry/Fish/Hunt | 4 |
| Mining | 0 |
| Utilities | 0 |
| Construction | 13 |
| Manufacturing | 4 |
| Wholesale Trade | 0 |
| Retail Trade | 66 |
| Motor Veh/Parts Dealers | 5 |
| Furn & Home Furnish Str | 0 |
| Electronics & Appl Store | 0 |
| Bldg Matl/Garden Equip | 0 |
| Food & Beverage Stores | 43 |
| Health/Pers Care Stores | 5 |
| Gasoline Stations | 3 |
| Clothing/Accessory Store | 0 |
| Sports/Hobby/Book/Music | 0 |
| General Merchandise Str | 10 |
| Misc Store Retailers | 0 |
| Nonstore Retailers | 0 |
| Transportation/Warehouse | 19 |
| Information | 11 |
| Finance & Insurance | 47 |
| Cntrl Bank/Crdt Intrmdtn | 18 |
| Sec/Cmdty Cntrct/Oth Inv | 0 |
| Insur/Funds/Trusts/Other | 29 |
| Real Estate/Rent/Leasing | 1 |
| Prof/Scientific/Tech Srv | 7 |
| Legal Services | 3 |
| Mgmt of Comp/Enterprises | 0 |
| Admin/Support/Waste Mgmt | 2 |
| Educational Services | 112 |
| HealthCare/Social Assist | 340 |
| Arts/Entertainment/Rec | 6 |
| Accommodation/Food Srvcs | 19 |
| Accommodation | 1 |
| Food Srv/Drinking Places | 18 |
| Other Srv excl Pub Admin | 34 |
| Auto Repair/Maintenance | 3 |
| Public Administration Emp | 8 |
Source: ESRI, 2023-10-17
Educational Attainment (25+)
| Plainview | 2023 |
|---|---|
| Some High School | 66 |
| Graduated High School | 327 |
| Associates Degree | 105 |
| Bachelor's Degree | 110 |
| Graduate Degree | 34 |
Source: ESRI, 2023-10-17
Back To TopBusinesses
Businesses by NAICS
| Category | Number |
|---|---|
| Total Businesses | 77 |
| Agr/Forestry/Fish/Hunt Bus | 2 |
| Mining Bus | 0 |
| Utilities Bus | 0 |
| Construction Bus | 6 |
| Manufacturing Bus | 1 |
| Wholesale Trade Bus | 0 |
| Retail Trade Bus | 10 |
| Motor Veh/Parts Dealers Bus | 2 |
| Furn & Home Furnish Str Bus | 0 |
| Electronics & Appl Store Bus | 0 |
| Bldg Matl/Garden Equip Bus | 0 |
| Food & Beverage Stores Bus | 3 |
| Health/Pers Care Stores Bus | 1 |
| Gasoline Stations Bus | 1 |
| Clothing/Accessory Store Bus | 0 |
| Sports/Hobby/Book/Music Bus | 0 |
| General Merchandise Str Bus | 3 |
| Misc Store Retailers Bus | 0 |
| Nonstore Retailers Bus | 0 |
| Transportation/Warehouse Bus | 2 |
| Information Bus | 2 |
| Finance & Insurance Bus | 10 |
| Cntrl Bank/Crdt Intrmdtn Bus | 2 |
| Sec/Cmdty Cntrct/Oth Inv Bus | 0 |
| Insur/Funds/Trusts/Other Bus | 8 |
| Real Estate/Rent/Leasing Bus | 1 |
| Prof/Scientific/Tech Srv Bus | 2 |
| Legal Services Bus | 1 |
| Mgmt of Comp/Enterprises Bus | 0 |
| Admin/Support/Waste Mgmt Bus | 1 |
| Educational Services Bus | 4 |
| HealthCare/Social Assist Bus | 12 |
| Arts/Entertainment/Rec Bus | 3 |
| Accommodation/Food Srvcs Bus | 5 |
| Accommodation Bus | 1 |
| Food Srv/Drinking Places Bus | 4 |
| Other Srv excl Pub Admin Bus | 13 |
| Auto Repair/Maintenance Bus | 3 |
| Public Administration Bus | 3 |
Source: ESRI, 2023-10-17
Back To Top